Page 92 -
P. 92

92          ENVIRONMENTAL, SOCIAL AND GOVERNANCE REPORT 2020                                                                                                                               DATA AND REPORTING        93


                                                       Unit          2020     2019     2018    2017     2016                       Environmental Performance
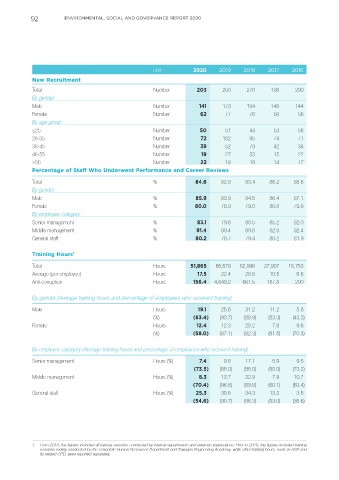


            New Recruitment


            Total                                      Number         203      250      270     198      200                                            1               Unit            2020      2019      2018     2017      2016
            By gender                                                                                                              Energy Consumption
            Male                                       Number          141     173      194     148      144                       Towngas Headquarters
            Female                                     Number          62       77       76      50       56                       Electricity                           GJ            19,384    20,252   20,350    20,921    21,383
            By age group                                                                                                           Town gas                              GJ             1,392     2,258    2,104     2,020     2,217
            ≤25                                        Number          50       51       44      53       56                       Gas production process                GJ          165,304    164,242  148,134   137,142   150,251
                                                                                                                                   Indirect: Electricity
            26-35                                      Number          72      102       95      74       71                       Direct: Naphtha                       GJ           665,811   720,641  671,808   628,760   616,538
            36-45                                      Number          39       52       79      42       34                            Natural gas                      GJ         5,178,927  5,383,668  5,287,475  5,033,398  5,069,673
            46-55                                      Number           19      27       33      15       22                            Synthetic natural gas and landfill   GJ       124,985    42,038  325,950   584,126   481,963
            ≥56                                        Number          23       18       19      14       17                            gas
            Percentage of Staff Who Underwent Performance and Career Reviews                                                            Town gas                         GJ           175,038   172,701  172,617   160,011   168,086
                                                                                                                                        Diesel                           GJ             1,300     1,537    1,480     1,373     1,365
            Total                                      %              84.6     82.8    83.4     85.2    85.6                       Total energy consumption              GJ         6,487,876  6,544,810  6,607,464  6,484,827  6,311,365
            By gender                                                                                                              Vehicle fleet  2
                                                                                                                                                                                        8,797
            Male                                       %              85.9     83.9    84.5     86.4    87.1                       Unleaded petrol                       GJ            11,810    10,231   11,500    12,679    14,518
                                                                                                                                   Diesel
                                                                                                                                                                                                                    11,316
                                                                                                                                                                                                                              10,172
                                                                                                                                                                                                 12,017
                                                                                                                                                                                                          11,429
                                                                                                                                                                         GJ
            Female                                     %              80.0     78.9    79.0     80.8    79.8
            By employee category                                                                                                   Packaging Material Use
            Senior management                          %              83.1     79.6    80.5     85.2    82.0                       Carton                              Tonnes            842       946       942      889       822
            Middle management                          %              91.4     89.4    89.8     82.9    92.4                       Wood                                Tonnes            15.5      17.7     19.8       18        29
            General staff                              %              80.2     78.7    79.4     80.2    81.9                       Plastic                             Tonnes            1.41      0.88     0.45       0.7      0.9
                                                                                                                                   Emissions
            Training Hours 1                                                                                                       Carbon Dioxide (CO2)         Daily average in metric   884      912       928      915       907
            Total                                      Hours        51,865   65,679  82,996   27,907  15,753                                                    tonnes (Metric tonnes   (11.90)  (11.90)   (11.70)  (11.64)   (11.55)
            Average (per employee)                     Hours          17.5     22.4    28.6     10.5     6.6                       Nitrogen Oxides (NOx)        per million MJ of town gas)  298   308       317      311       314
                                                                                                                                                                Daily average in kg (kg
            Anti-corruption                            Hours         156.4  4,649.2   661.5    187.8     200                                                    per million MJ of town gas)  (4.0)  (4.00)  (4.00)   (4.00)    (4.00)
                                                                                                                                   Sulphur Oxides (SOx)         Daily average in kg (kg   1.0      1.0       1.4       1.9      1.4
            By gender (Average training hours and percentage of employees who received training)                                                                per million MJ of town gas)  (0.01)  (0.01)  (0.02)  (0.02)    (0.02)
                                                                                                                                   Greenhouse gases             Tonnes CO2e          344,549    357,060  347,489   329,741   333,841
            Male                                       Hours           19.1    25.6    31.2     11.2     5.8                       (production equipment) 3
                                                       (%)           (63.4)   (93.7)   (88.9)  (53.3)   (43.3)                     Water Consumption and Discharge (Gas Production)    4
            Female                                     Hours          12.4     12.3    20.2      7.8     9.6
                                                       (%)           (58.0)   (87.1)   (82.3)  (61.5)   (70.3)                     Water consumption            m 3                  982,034   995,239   988,981  1,094,363  1,162,611
                                                                                                                                                                (m per million MJ of    (35.9)    (35.3)    (34.0)   (38.1)    (40.5)
                                                                                                                                                                  3
                                                                                                                                                                town gas)
            By employee category (Average training hours and percentage of employees who received training)                        Total wastewater discharged  Daily average in m  (m    270      306      308       319       321
                                                                                                                                                                                3
                                                                                                                                                                             3
            Senior management                          Hours (%)       7.4      9.8    17.1      5.9     9.5                                                    per million MJ of town gas)  (3.50)  (3.90)  (3.90)  (4.10)    (4.10)
                                                                     (73.5)   (85.0)   (85.0)  (50.0)   (73.2)                     Treated wastewater discharged to    Daily average in m 3  37     45        52       62        79
            Middle management                          Hours (%)       8.3     13.7    22.9      7.9    10.7                       marine water bodies          Daily average in m 3     232       261       257      258       241
                                                                                                                                   Wastewater discharged to sewage
                                                                     (70.4)   (96.8)   (89.8)  (60.1)   (63.4)
            General staff                              Hours (%)      25.3     30.5    34.3     13.2     3.5
                                                                     (54.6)   (90.7)   (86.3)  (53.0)   (35.6)
                                                                                                                                   1.  The following conversion factors are used to standardise the units to gigajoules (GJ): Town gas (0.048GJ/unit), electricity (0.0036GJ/kWh), petrol (0.033GJ/
                                                                                                                                      L), diesel (0.036GJ/L). The conversion of naphtha and landfill gas to energy is calculated by multiplying individual monthly fuel volumetric data by their
                                                                                                                                      corresponding monthly average calorific value.
                                                                                                                                   2.  Tankers and ECO Aviation Fuel Services (EAFS) vehicles are excluded.
                                                                                                                                   3.  GHG inventory covers seven types of GHGs specified in the Kyoto Protocol. The global warming potential rates were from the IPCC Fifth Assessment Report
                                                                                                                                      (2014).
                                                                                                                                      Emission  factors  of  GHG  emissions  due  to  electricity  consumption  are  obtained  from  two  local  electricity  companies,  while  other  emission factors  were
                                                                                                                                      obtained from local governments and authorities, or other recognised sources.
            1.  From 2018, the figures included all training sessions conducted by internal departments and external organisations. Prior to 2018, the figures included training      Scope 1 GHG emissions were adjusted to reflect the biogenic nature of landfill gas and its associated carbon emissions during use.
               sessions mainly conducted by the Corporate Human Resources Department and Towngas Engineering Academy, while other training hours, such as HSE and   4.  All water is freshwater purchased and distributed by the HKSAR Water Supplies Department. All wastewater handling procedures comply with the local
               its related CPD, were reported separately.                                                                             regulations.
   87   88   89   90   91   92   93   94   95   96   97