
Page 90 -
P. 90
90 ENVIRONMENTAL, SOCIAL AND GOVERNANCE REPORT 2020 DATA AND REPORTING 91
Key Statistics Employees
Unit 2020 2019 2018 2017 2016
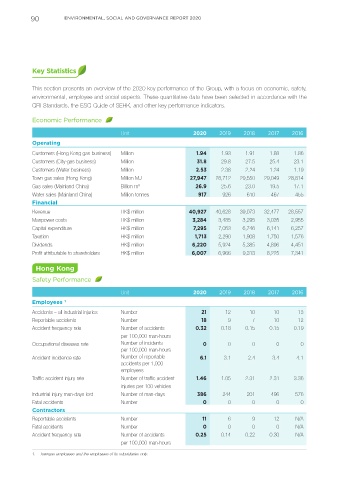
This section presents an overview of the 2020 key performance of the Group, with a focus on economic, safety, Total Headcount
environmental, employee and social aspects. These quantitative data have been selected in accordance with the
GRI Standards, the ESG Guide of SEHK, and other key performance indicators. Hong Kong gas business Number 2,130 2,096 2,052 2,022 2,019
All Hong Kong staff 1
Economic Performance Full-time Number 2,495 2,474 2,418 2,388 2,392
Part-time Number 140 118 112 94 116
Unit 2020 2019 2018 2017 2016 By gender
Operating Male Number 1,950 1,943 1,908 1,877 1,887
Customers (Hong Kong gas business) Million 1.94 1.93 1.91 1.88 1.86 Female Number 545 531 510 511 505
Customers (City-gas business) Million 31.8 29.8 27.5 25.4 23.1 Ratio of male to female – Senior management Ratio 3.1:1 3.3:1 3.4:1 3.4:1 3.4:1
Customers (Water business) Million 2.53 2.38 2.24 1.24 1.19 Ratio of male to female – Middle management Ratio 3.0:1 3.1:1 3.0:1 3.0:1 3.2:1
Town gas sales (Hong Kong) Million MJ 27,947 28,712 29,550 29,049 28,814 Ratio of male to female – General staff Ratio 4.2:1 4.3:1 4.5:1 4.4:1 4.3:1
Gas sales (Mainland China) Billion m 3 26.9 25.6 23.0 19.5 17.1 By age group
Water sales (Mainland China) Million tonnes 917 926 610 467 455 ≤25 Number 147 139 124 123 126
Financial 26-35 Number 465 444 400 395 372
Revenue HK$ million 40,927 40,628 39,073 32,477 28,557 36-45 Number 480 486 496 475 487
Manpower costs HK$ million 3,284 3,485 3,295 3,035 2,955 46-55 Number 750 787 823 861 909
Capital expenditure HK$ million 7,295 7,053 6,746 6,141 6,257 ≥56 Number 653 618 575 534 498
Taxation HK$ million 1,713 2,290 1,908 1,750 1,576 By employee category
Dividends HK$ million 6,220 5,924 5,385 4,896 4,451 Senior management Number 267 265 251 236 239
Profit attributable to shareholders HK$ million 6,007 6,966 9,313 8,225 7,341
Middle management Number 918 925 889 843 831
General staff Number 1,310 1,284 1,278 1,309 1,322
Hong Kong
Safety Performance Turnover Rate
Unit 2020 2019 2018 2017 2016 Average turnover of workforce (Hong Kong gas business) % 3.9 5.7 6.8 5.7 5.8
Employees 1 Average turnover of workforce (all Hong Kong staff) % 5.0 5.7 8.7 6.4 6.7
Accidents – all industrial injuries Number 21 12 10 10 13 By gender
Reportable accidents Number 18 9 7 10 12 Male % 4.2 4.6 7.0 5.6 6.0
Accident frequency rate Number of accidents 0.32 0.18 0.15 0.15 0.19 Female % 7.6 9.8 15.1 9.3 9.0
per 100,000 man-hours By age group
Occupational diseases rate Number of incidents 0 0 0 0 0 ≤25 % 4.9 12.2 16.2 19.3 21.3
per 100,000 man-hours 26-35 % 9.2 10.9 20.4 13.0 14.8
Accident incidence rate Number of reportable 6.1 3.1 2.4 3.4 4.1
accidents per 1,000 36-45 % 4.3 7.3 9.9 7.1 6.1
employees 46-55 % 2.7 2.5 4.4 2.6 3.4
Traffic accident injury rate Number of traffic accident 1.46 1.05 2.31 2.31 3.36 ≥56 % 5.0 3.7 4.1 4.1 3.4
injuries per 100 vehicles
Industrial injury man-days lost Number of man-days 386 244 201 496 576
Fatal accidents Number 0 0 0 0 0
Contractors
Reportable accidents Number 11 6 9 12 N/A
Fatal accidents Number 0 0 0 0 N/A
Accident frequency rate Number of accidents 0.25 0.14 0.22 0.30 N/A
per 100,000 man-hours
1. A revised scope was adopted in 2016. The scope includes the employees of companies with business in Hong Kong (i.e. Towngas, Towngas Enterprise
1. Towngas employees and the employees of its subsidiaries only. Limited, ECO Stations, TGT and U-Tech). The figures have been adjusted accordingly.